
Before diving into the fun details, here is the full data flow of the setup. This shows the journey from the original Blackstone app to the final Grafana dashboard.
 ┌──────────────────┐        ┌──────────────────────────┐
 │  Blackstone APK   │        │  Hidden Blackstone API   │
 │ (reverse engineered)──────▶│ (backend endpoints)       │
 └──────────────────┘        └──────────────────────────┘
                                     │
                                     ▼
                            ┌────────────────┐
                            │  Python Script │
                            │  (collector)   │
                            └────────────────┘
                                     │
                                     ▼
                        ┌──────────────────────────┐
                        │  Prometheus Remote Write │
                        │   via Grafana Cloud      │
                        └──────────────────────────┘
                                     │
                                     ▼
                         ┌─────────────────────────┐
                         │      Grafana Dashboard  │
                         │  (generated by Claude)   │
                         └─────────────────────────┘
The Story
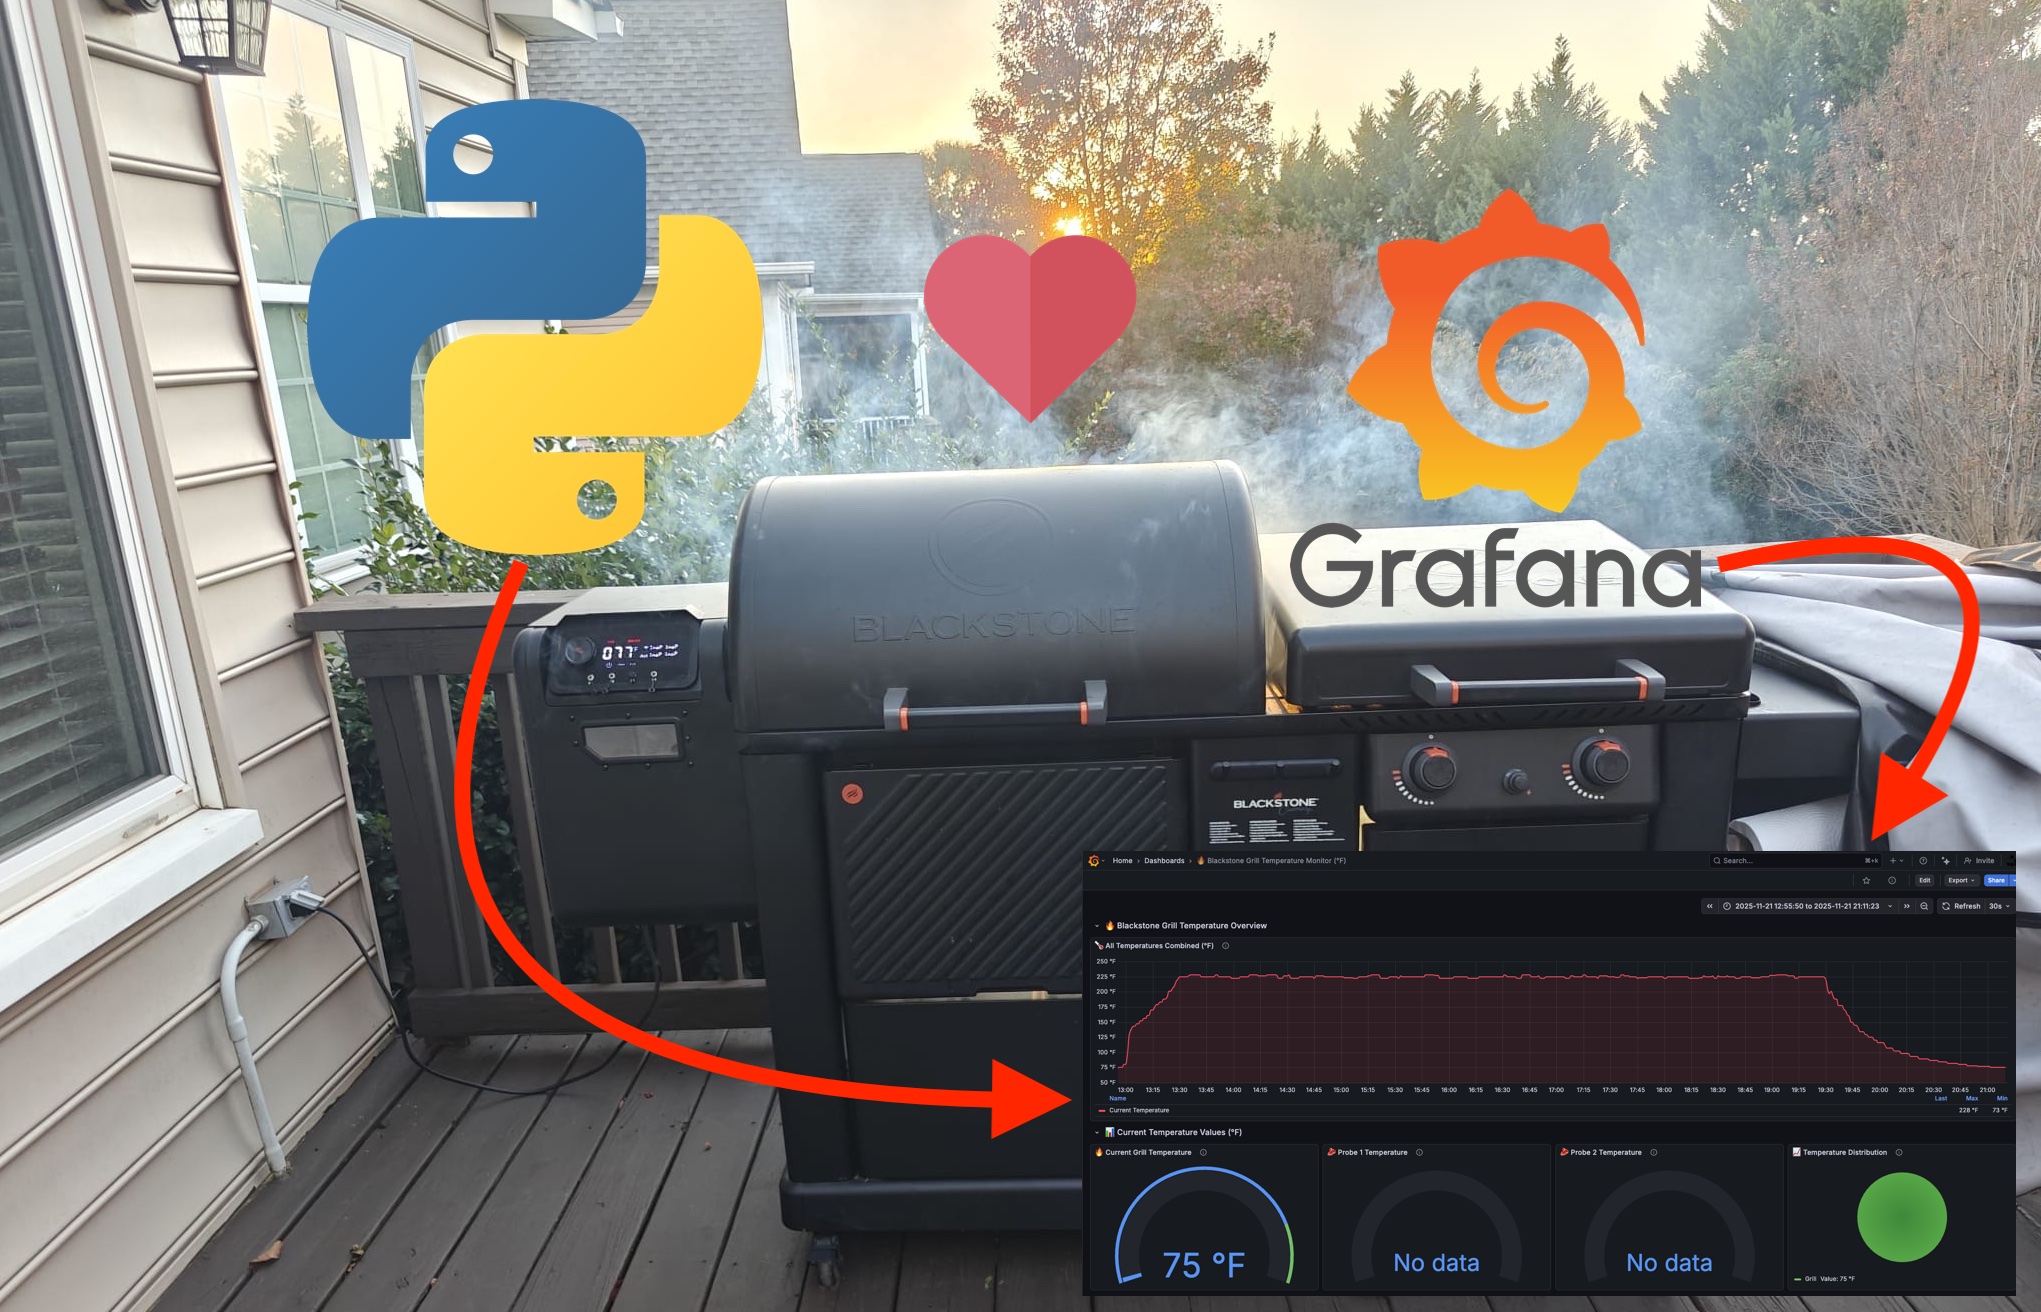
I love my Blackstone smoker, but the official Blackstone Connect mobile app was a bit limited for what I wanted. It worked fine, but I could not get long term history, pretty graphs, alerts, or anything close to proper observability. Since I already use Grafana Cloud for a bunch of personal projects, putting the smoker data there became an obvious objective.
This turned into a fun mix of reverse engineering, API exploration, Python hacking, and finally dashboard building. The surprising part is that the final dashboard was generated automatically by Claude and worked perfectly without any edits.
Here is how everything came together.
Reverse engineering the Blackstone Connect App
The first challenge was figuring out where the app gets its data. There is no public API documentation, and the APK does not openly expose anything.
So I pulled the APK from my phone, unpacked it, and looked at the network calls and code. Pretty quickly I found the back end. The app makes requests to a set of internal endpoints under:
https://backend.app.blackstoneconnect.com/meta/bulk
These endpoints return exactly what I needed:
- Current smoker temperature
- Probe temperatures
- Device status
- Firmware information
Inside the APK I found the authentication flow, including how the app exchanges a refresh token for a session token. That was the key. Once I reproduced that flow in Python, I could authenticate and fetch data the same way the official app does.
Here is the cleaned up authentication function:
def get_auth_token():
    """Get authentication token from the Blackstone API."""

    auth_url = "https://backend.app.blackstoneconnect.com/meta/bulk"
    auth_headers = {
        "Accept": "*/*",
        "Content-Type": "application/json",
        "User-Agent": "Python-Smoker-Monitor",
    }

    # Scrubbed, originally came from the reversed APK
    auth_payload = {
        "request_1": {
            "path": "/auth/token/simple",
            "method": "POST",
            "body": '"refresh/User/REDACTED_REFRESH_TOKEN"',
        }
    }

    try:
        response = requests.post(auth_url, headers=auth_headers, data=json.dumps(auth_payload))
        data = response.json()
        token = data["request_1"]["result"].strip('"')
        return token, auth_headers
    except Exception as e:
        print(f"Failed to get auth token: {e}")
        return None, None
Fetching Smoker Telemetry
Once authenticated, the next step was fetching the actual data. The API returns a data structure containing the smoker temperature and up to four probes.
Here is the cleaned up version of that request:
def get_grill_data(token, auth_headers):
    """Fetch smoker telemetry from the Blackstone backend."""

    url = "https://backend.app.blackstoneconnect.com/meta/bulk"
    headers = auth_headers.copy()
    headers["authorization"] = token

    payload = {
        "request_telemetry": {
            "path": "/pellet-grills/query",
            "method": "POST",
            # Device ID scrubbed
            "body": json.dumps({"condition": {"_id": {"Inside": ["REDACTED_DEVICE_ID"]}}}),
        }
    }

    try:
        response = requests.post(url, headers=headers, data=json.dumps(payload))
        data = response.json()
        telemetry = json.loads(data["request_telemetry"]["result"])[0]
        return telemetry
    except Exception as e:
        print(f"Failed to retrieve data: {e}")
        return None
Most values come back in Celsius, so I added a helper:
def to_fahrenheit(c):
    if c is None:
        return None
    return (c * 9 / 5) + 32
Pushing metrics to Grafana Cloud
I wanted Prometheus style metrics, but Grafana Cloud also supports Influx line protocol via remote write. It is simple and works great for this use case.
Here is the cleaned snippet that creates the metrics and pushes them:
def send_to_grafana(grill):
    """Convert metrics into Influx line protocol and push to Grafana Cloud."""

    timestamp_ms = int(time.time() * 1000)

    metrics = []
    current_f = to_fahrenheit(grill["currentTemperature"])
    if current_f is not None:
        metrics.append({
            "name": "blackstone_smoker_temperature_f",
            "value": current_f,
            "labels": {"job": "blackstone", "device": "smoker"},
        })

    probes = {
        "probe1": grill.get("probe1Temperature"),
        "probe2": grill.get("probe2Temperature"),
        "probe3": grill.get("probe3Temperature"),
        "probe4": grill.get("probe4Temperature"),
    }

    for name, celsius in probes.items():
        f = to_fahrenheit(celsius)
        if f is not None:
            metrics.append({
                "name": f"blackstone_{name}_temperature_f",
                "value": f,
                "labels": {"job": "blackstone", "probe": name},
            })

    lines = []
    for m in metrics:
        tags = ",".join([f"{k}={v}" for k, v in m["labels"].items()])
        line = f'{m["name"]},{tags} value={m["value"]} {timestamp_ms}000000'
        lines.append(line)

    payload = "\n".join(lines)

    # Base URL is fine to show
    url = "https://prometheus-prod-01-eu-west-1.grafana.net/api/v1/push/influx/write"

    headers = {
        "Content-Type": "text/plain",
        "Authorization": "Bearer GRAFANA_USERNAME:GRAFANA_API_KEY",
    }

    r = requests.post(url, headers=headers, data=payload)
    return r.status_code == 204
The Python collector loop
Here is the simplified main loop that ties everything together.
def main():
    print("Starting Blackstone Monitor")

    token, headers = get_auth_token()
    if not token:
        print("Unable to authenticate")
        return

    while True:
        data = get_grill_data(token, headers)
        if not data:
            print("Data fetch failed, retrying auth...")
            token, headers = get_auth_token()
            continue

        print(f"Smoker: {to_fahrenheit(data['currentTemperature'])} F")

        ok = send_to_grafana(data)
        if ok:
            print("Metrics sent")
        else:
            print("Failed to push metrics")

        time.sleep(60)
The result is a clean, reliable data pipeline that runs every minute and pushes fresh metrics to Grafana Cloud.
Building the dashboard with Claude
Once the metrics were flowing into Grafana Cloud, I originally planned to build a dashboard manually. But for fun, I asked Claude to generate the dashboard JSON instead.
Claude produced a complete, fully functional Grafana dashboard on the first try. I pasted the JSON into Grafana, saved it, and everything just worked. It included:
- A main smoker temperature graph
- Panels for each probe
- Clean labels and units
- Sensible panel layout
- Color choices that looked great without modifications
I still cannot believe how quickly it came together.
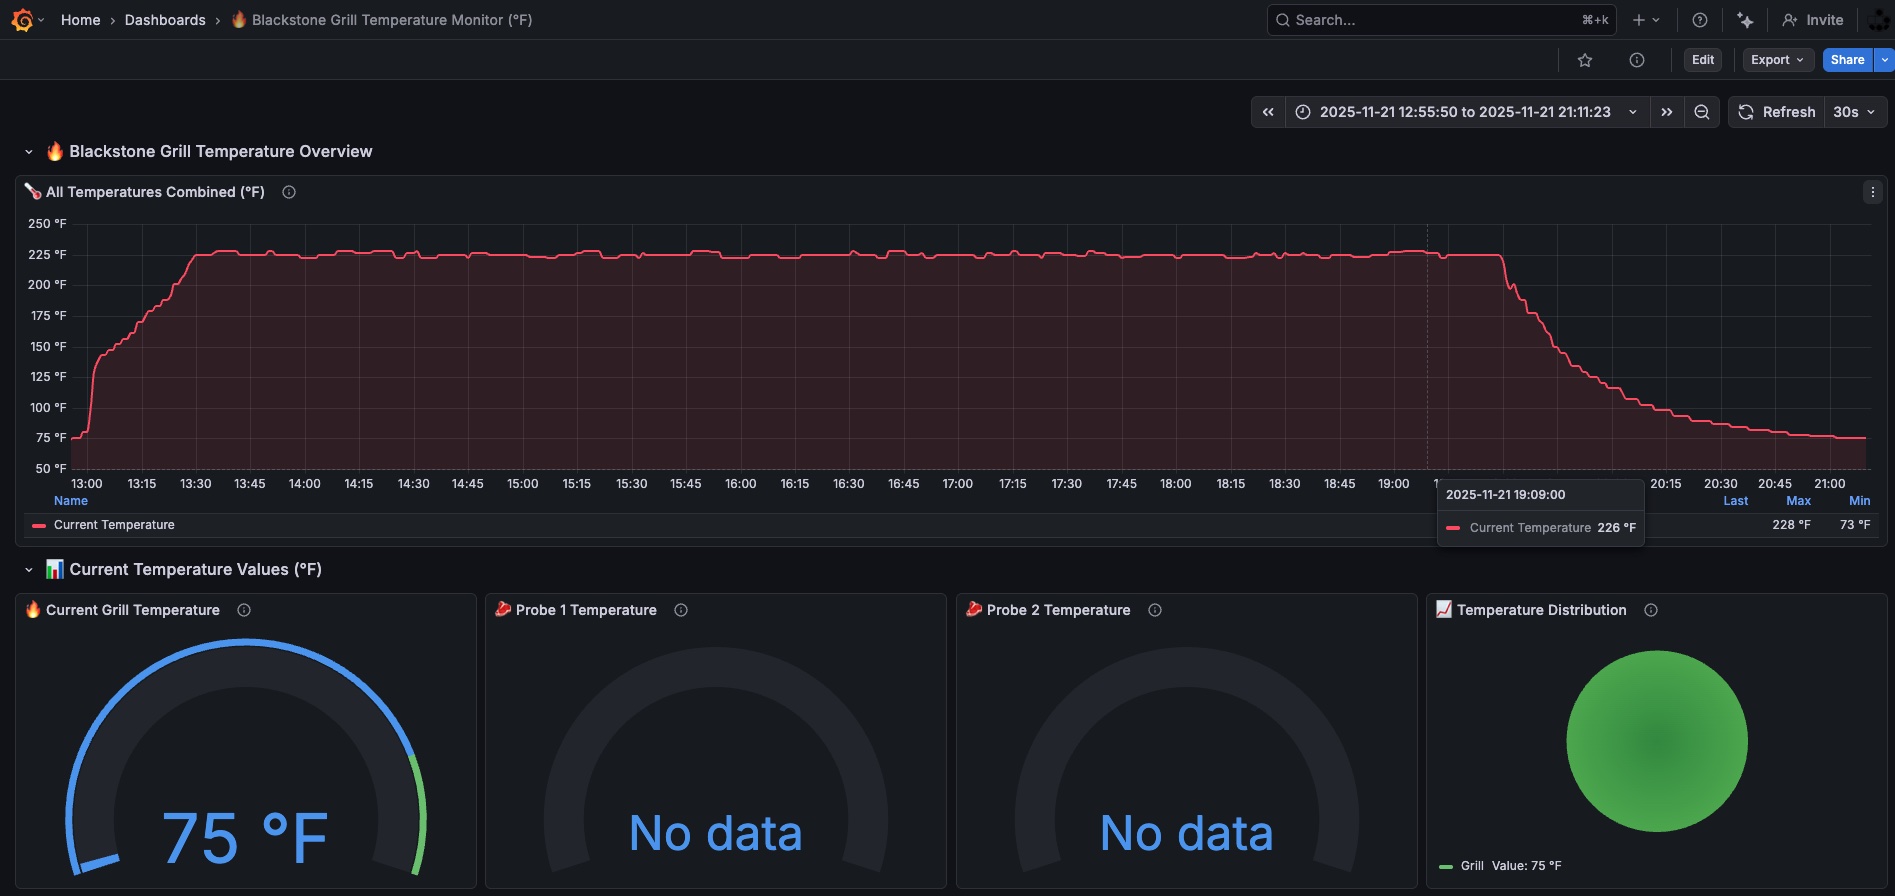
And what does it look like?
The final dashboard gives me:
- Real time temperature tracking
- Full history of all smokes
- Probe comparisons
- Alerts when the smoker dips below my target
- A clean overview I can check from anywhere
What started as a curiosity became one of my favorite DIY monitoring projects.
Final thoughts
This whole project combined reverse engineering, API discovery, Python scripting, Prometheus metrics, Grafana Cloud, and AI assisted dashboard creation. And honestly, having this data available opens the door to some really fun future ideas.
Now that I have structured time series data for every cook, there is potential for:
- Detecting when the hopper is running low on pellets based on temperature decay patterns
- Predicting the stall phase during long smokes
- Estimating time to completion for a brisket or pork shoulder
- Spotting anomalies like sudden drops caused by windy conditions or lid openings
- Building small AI agents that monitor trends and send playful alerts like “Hey, looks like you’re entering the stall, maybe grab a coffee”
None of that was possible with the original Blackstone app. With the telemetry flowing into Grafana and stored long term, this becomes a proper data playground. It turns a normal smoker into something you can analyze, visualize, and even forecast.
This started as a curiosity and became one of my favorite DIY monitoring projects. If you love smoking food, tinkering with tech, or both, this is an incredibly fun rabbit hole to explore.